Purchase Flower For Just Because Occasion: Part 2
By Ken Koon Wong in probability experiential learning
February 4, 2023
It was a fun year to be able to learn probability in real life! Happy Valentine’s Day 😆
So it has been a year since the real-life probability experiential learning roll-out. This is a continuum and a study of what happened after this. As a recap, I wrote an R script that runs daily for 2022 with a probability of telling me to purchase flowers of 6.58%, estimated at 24 bouquets over 365 days.
It is easy to imagine that, on average, the script would trigger me 24 times to buy flowers in a year. However, it is hard to imagine what a 6.58% of probability is of buying flowers daily. The probability seems so low that, intuitively (at least for me), it feels like a surprise when it does happen. When it doesn’t happen, it feels more likely to happen the next day. When it did happen, it feels like it shouldn’t happen on the next day.
The description of the feeling above is quite humanistic. These are the inherent biases that we have and how we as human beings (at least for most of us) do not have a natural intuition of probability theory. Why don’t we dive into my date.
Flower purchases visualized
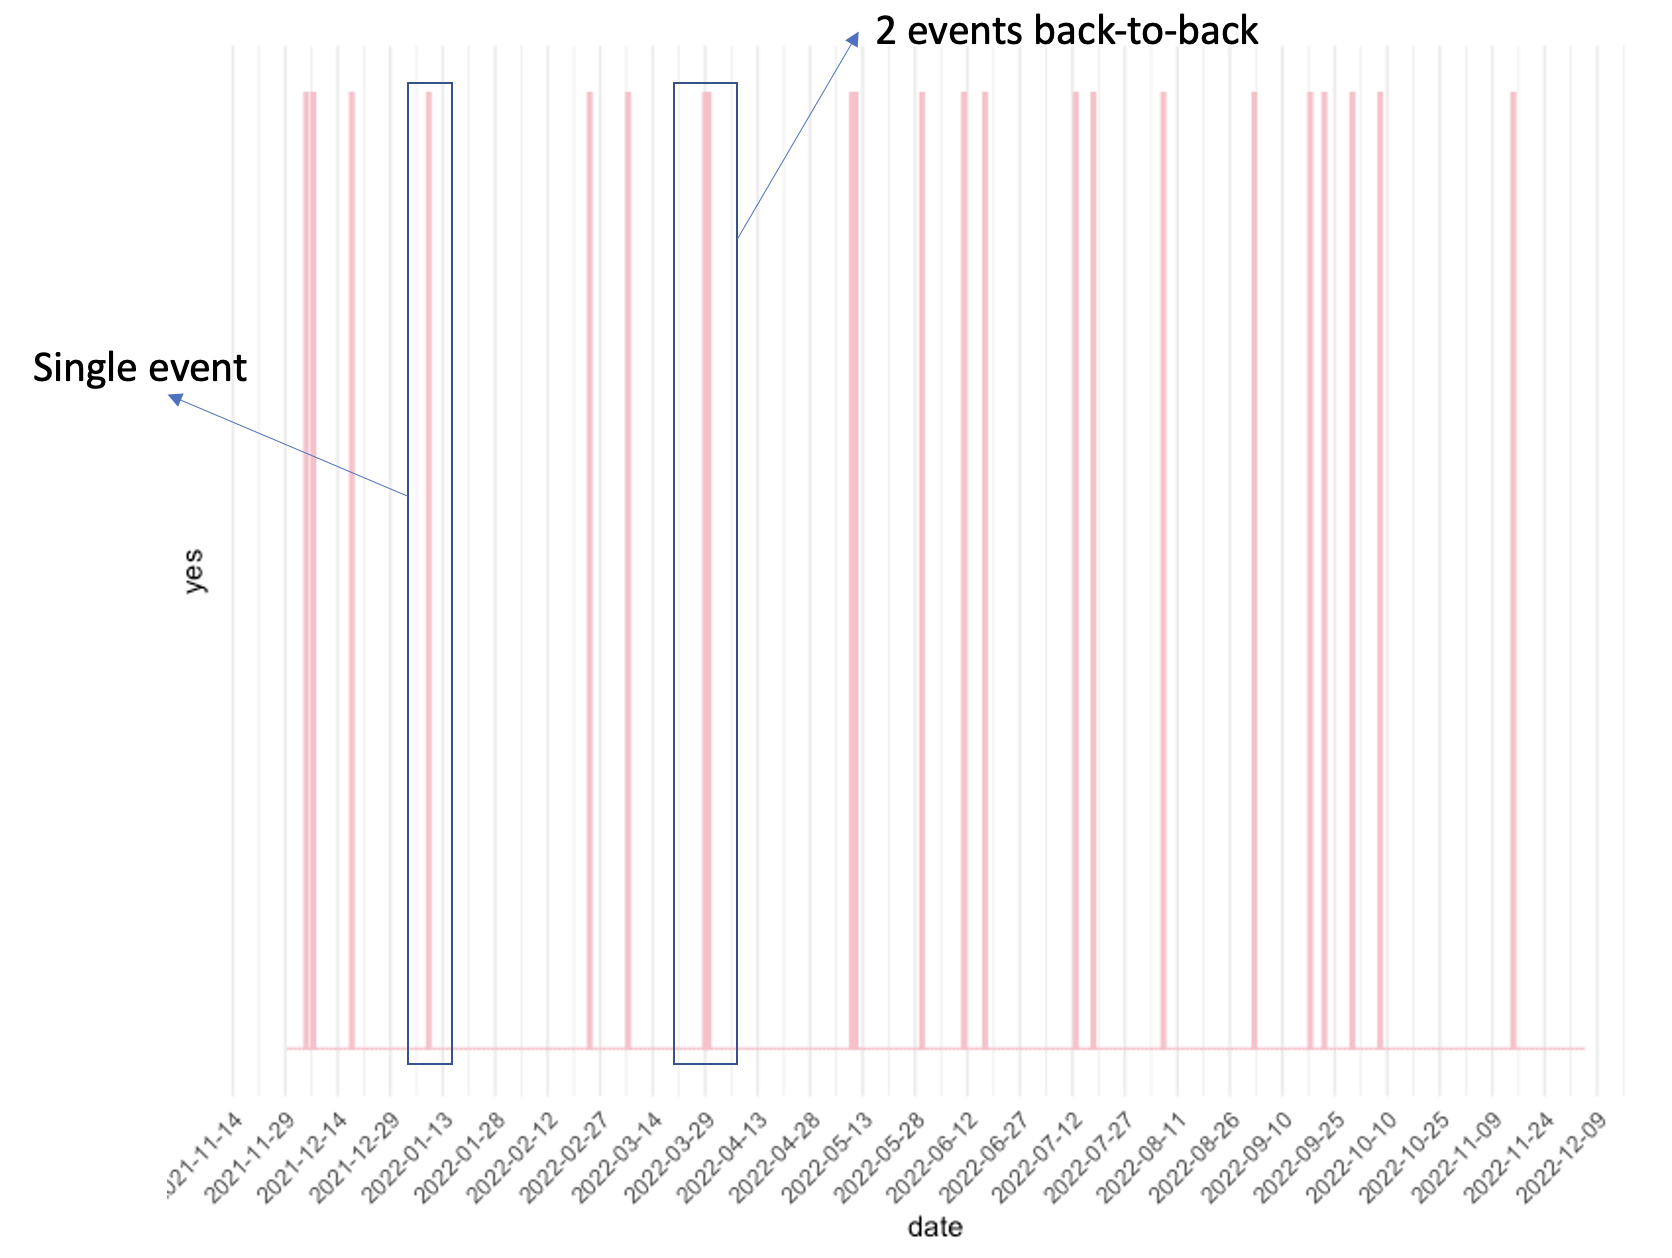 The above graph indicates when the script triggered me to buy flowers. As annotated on the left, a single event will have a thinner shape, whereas if there is a back-to-back purchase (e.g., script triggered to buy flower yesterday and today), the width will look thicker. The reason that I made this visualization is to give a sense of how the pattern, or lack thereof, looked like.
So, How Many Events Did We Get?
There were a total of 22 occurrences of flower purchases, which is quiet consistent with our goal! But one might say, it was 22 events, not 24, hence it must not be true! Let’s examine.
What is the probability of observing 22 or less events in 365 days, given the probability of buying 🌸 is 6.58% per day?
38.64%
Visualize probability density function through a histogram
set.seed(1234)
tibble(vec = rbinom(1000,365,24/365)) %>%
  ggplot(.,aes(x=vec)) +
  geom_histogram(color = "pink", fill = "pink", alpha = 0.5, bins = 10) +
  geom_vline(xintercept = 22) +
  theme_minimal()
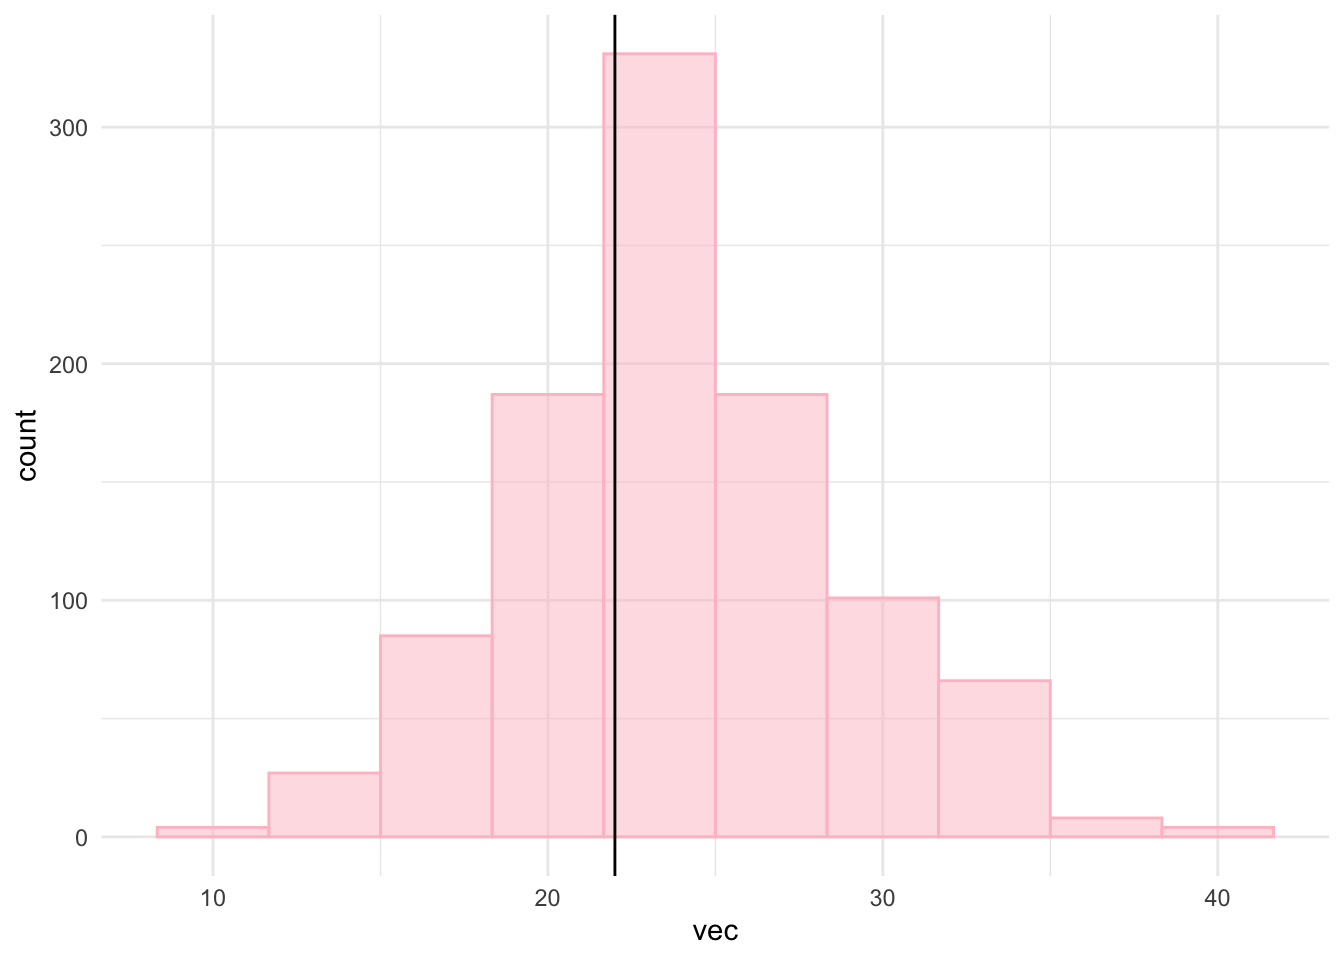
The black vertical line represents the event 22 on the histogram. As you can see, it is very close to the mean of the histogram.
How Many Events with Back-to-back purchase?
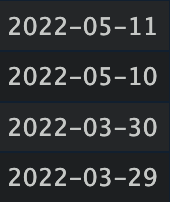
Wow there were 2 times where the script triggers to purchase flowers back-to-back! What is the probability? Given the independence of events, we can do
$$ P(\text{buy_flower} == 1) \times P(\text{buy_flower}== 1) \ = 0.0658 * 0.0658 \ = 0.00432964 $$
Yowza, 0.43%. But still happened! Should we be surprised?
Lessons learnt
- Probability theory is not intuitive. In my opinion, I think incorporating
experiential learninginto daily lives will provide a better sense of the theory - Have to add certain script to make sure mathjax loads so that equation can be seen on html.
If you like this article:
- please feel free to send me a comment or visit my other blogs
- please feel free to follow me on twitter, GitHub or Mastodon
- if you would like collaborate please feel free to contact me
- Posted on:
- February 4, 2023
- Length:
- 3 minute read, 536 words
- Categories:
- probability experiential learning
- See Also: