Is #IDWeek Community Leaving X?
By Ken Koon Wong in idweek2024 idweek2023 idweek23 idweek24 tweets posts twitter x learning idsa idweek
October 25, 2024
Not yet! After digging into both #IDWeek2023 and #IDWeek2024 tweets data, and crunching some numbers to compare user activity, it’s clear we haven’t lost our spark. Our ID community is still here, sharing knowledge and learning from each other’s experiences. Pretty cool to see how we’re keeping the conversation alive! Here’s hoping we can keep this momentum going and maybe even make it better!

Question Of The Day
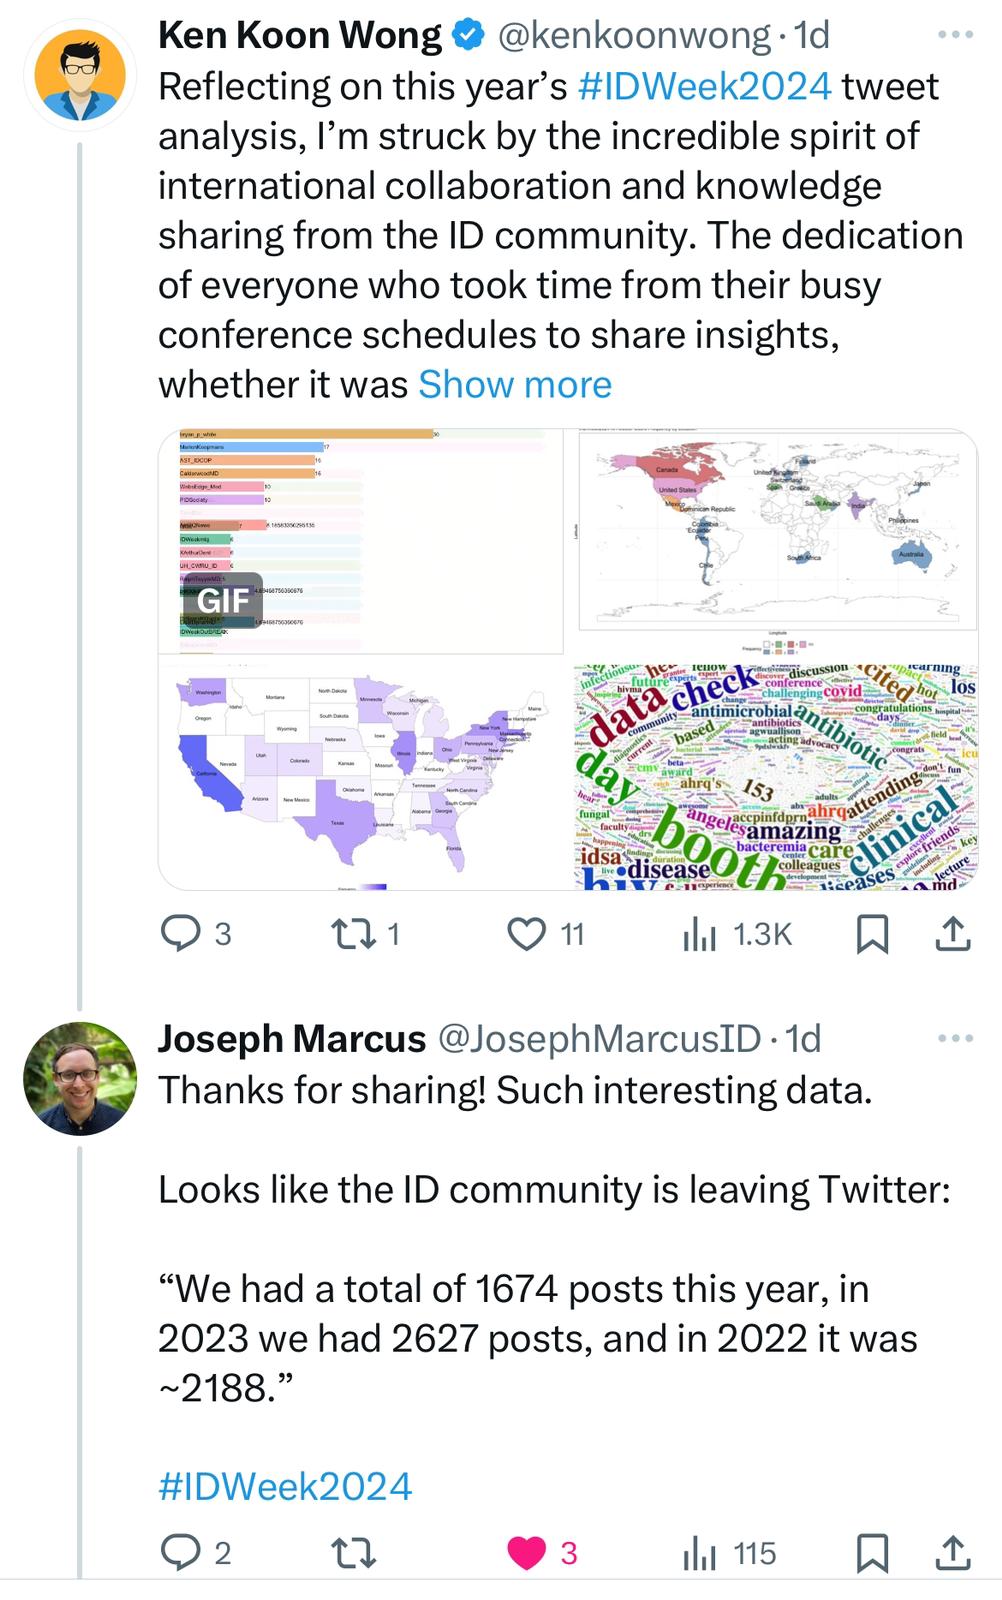
Joseph made a great point stating that IDweek Community may be leaving X, which may be the reason for why #IDweek2024 tweet counts were much lower than last year. Can we dive deeper into our 2023 and 2024 data and figure out if that is in fact true? Let’s put our counting, thinking and visualizing caps on and investigate!
Objectives:
- How are we going to do this?
- #IDWeek2023 vs #IDWeek2024 X Users
- Simulation
- Limitation
- Acknowledgement
- Lessons learnt
How Are We Going To Do This?
Let’s investigate #IDWeek2023 and #IDweek2024 tweets and its users. We will use the following sequential framework.
-
Compare the number of users between #IDweek2023 and #IDweek2024.
- we expect to seeing higher volume of unique users in 2023 since there were more tweets.
-
Assess returning and non-returning users.
- Definition: Returning users is defined as someone who posted in 2023 and 2024. Non-returning users is defined as someone who posted in 2023 but not in 2024. Non-user is defined as someone posted in 2023 but no longer has an account in 2024.
- What is the proportion of returning users?
- What is the proportion of non-returning users?
- What is the proportion of non-user?
- For non-returning users, are they active on X? With
activedefined as having tweeted/retweeted for the past 2 weeks of query (10-25-2024) - For non-returning users, who are not active on X, how many posts did they contribute in 2023?
-
Simulate a data generating process (DGP) of 2023 and 2024 post counts, is it possible that non-returning, non-active X users, may have contributed to the decline in 2024 posts?
- Use Poisson distribution to simulate total 2023, total 2024, and non-returning non-active X users post counts
- Create a new variable which is potential 2024 = total 2024 + non-returning non-active X users post counts
- Visualize simulated total 2023 and potential 2024 post couunts
- Assess if simulated lower bound of total 2023 overlaps with potential 2024 post counts, using 3 standard devviations
#IDWeek2023 vs #IDWeek2024 X Users
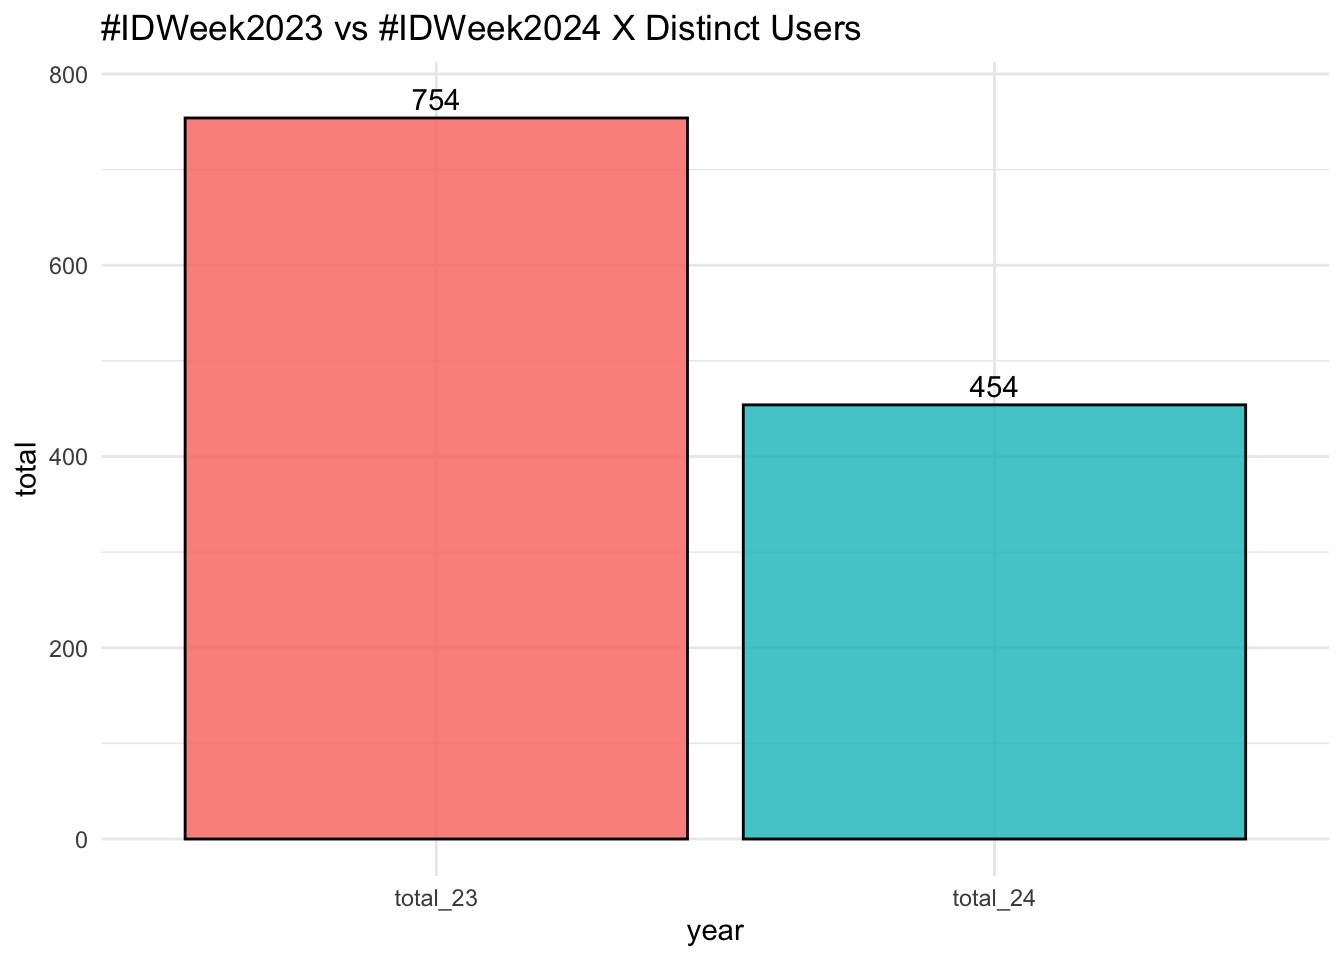
There were 754 distinct users who tweeted in 2023 and 454 distinct users who tweeted in 2024. That’s a huge difference!
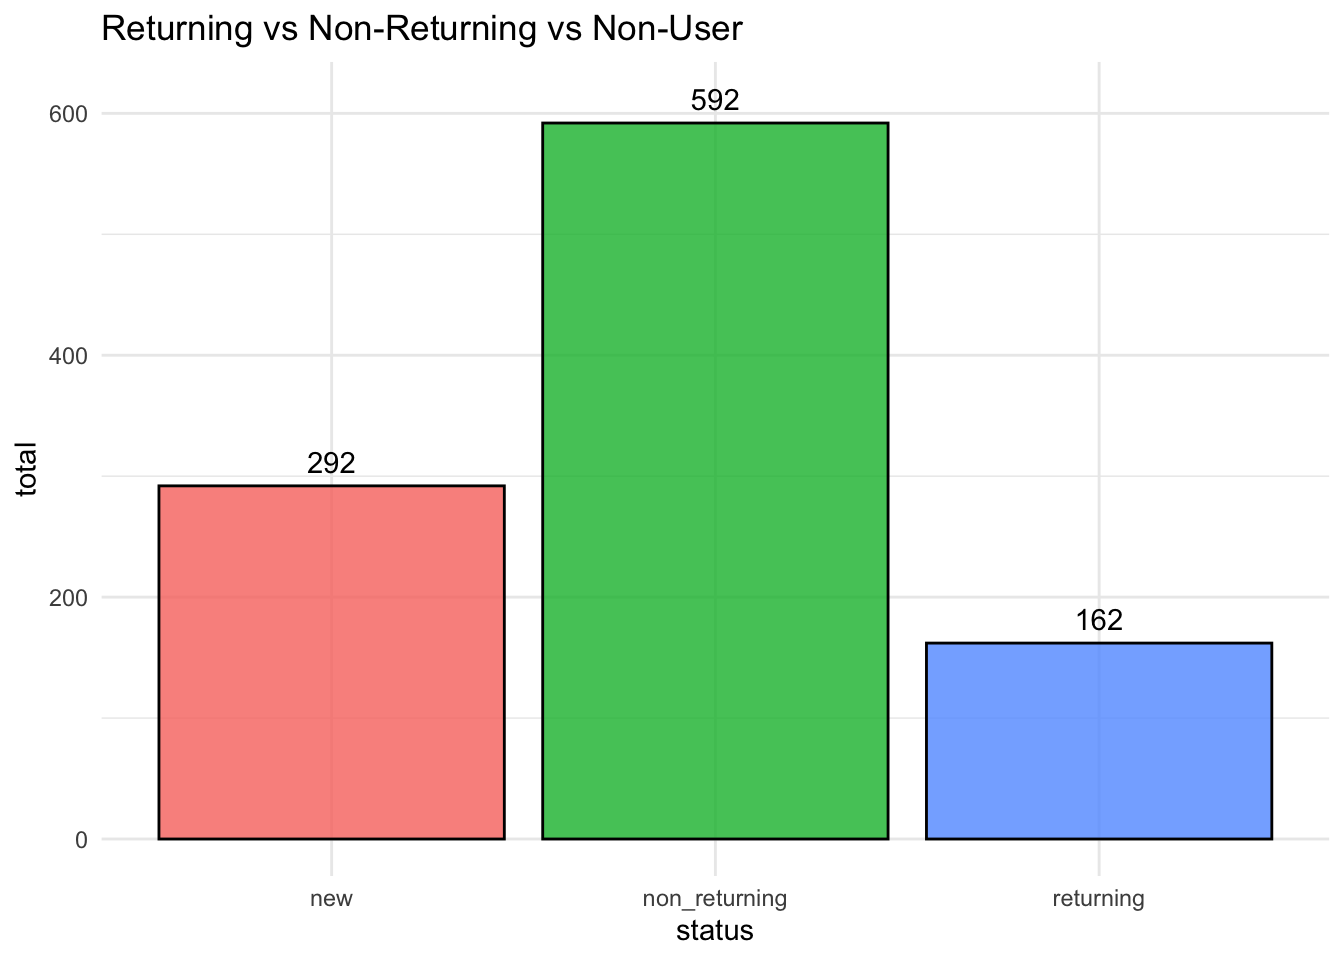
What is the proportion of returning, non-returning, and new users?
Let’s do some sanity check, numbers should add up.
New + returning = total 2024 counts (454)
non-returning + returning = total 2023 counts (754)
🙌 yes! Tallied ok.
Returning users were users who were presented in both #IDweek2023 and #IDweek2024. Non-returning users were ones who were present in #IDweek2023 but not #IDweek2024. New users were those who were not present in #IDweek2023 but present in #IDweek2024. We’re interested in looking at those 592 non-returning users! That’s a lot of users missing in #IDweek2024, is it true that we might have a major exodus this year?
Investigating The Non-returning X Users
Interestingly, of the 592 non-returning users, 44 users no longer have an acount on X. Were they bots? Or did they just leave X? They had contributed 123 #IDweek2023 posts.
For non-returning users, are they active on X?
With active defined as having tweeted/retweeted for the past 2 weeks of query (10-25-2024)
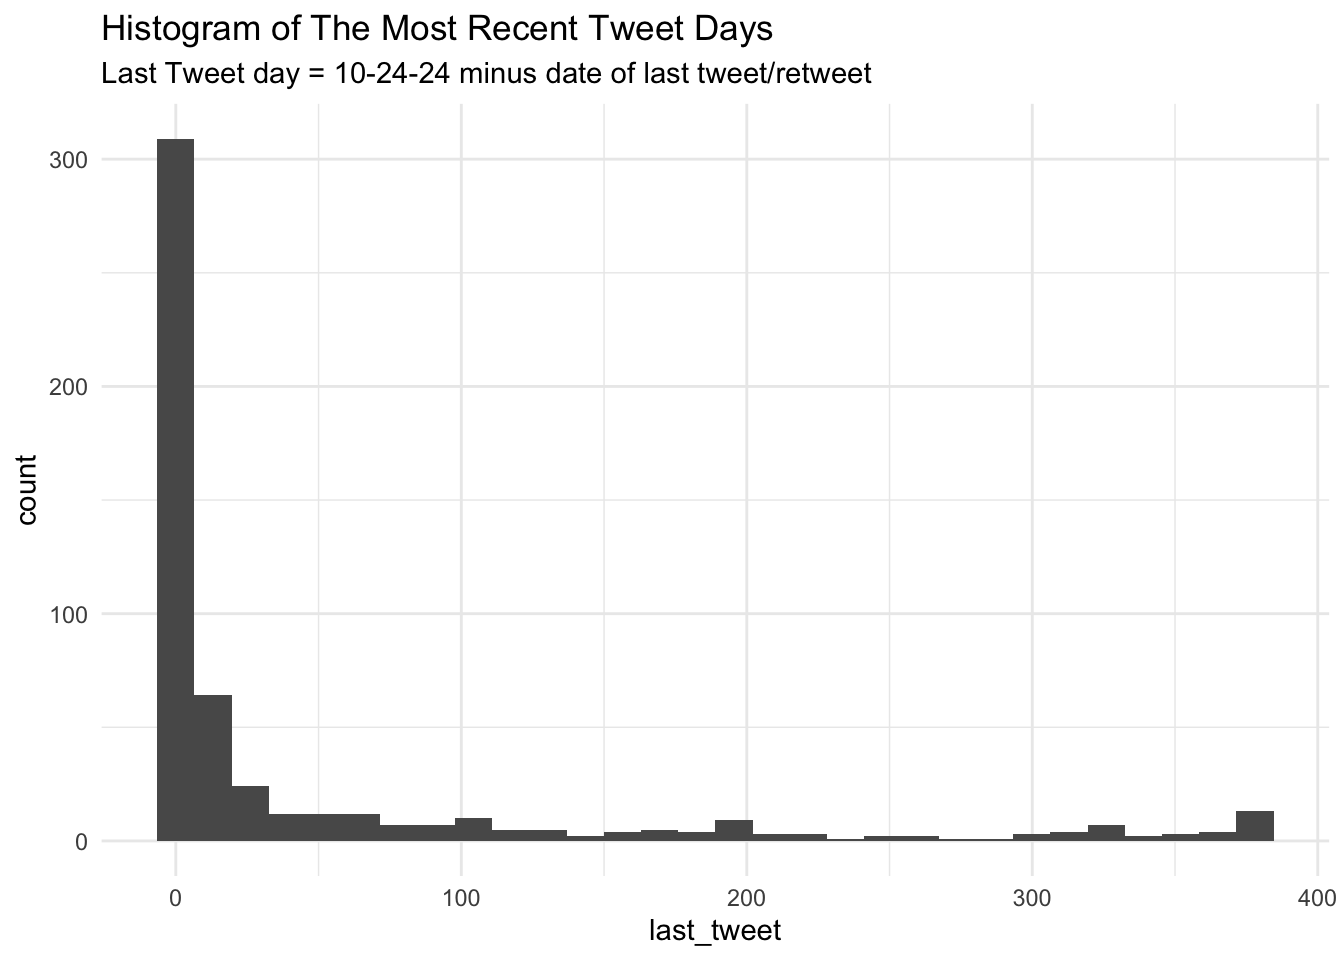
Looks like quite a lot of non-returning X users had recent tweets! Let’s check out the statistics.
Median: 4 days.
SD: 97.1633757 days.
Min: 0 days.
25% tile: 0 days.
75% tile: 42 days.
Max: 378 days.
So, how many users actually had longer than 14 days of recent tweet? 182. And that makes 358 non-returning users who are still active on X! Good news so far! 🙌
For non-returning users, who are NOT ACTIVE on X, how many posts did they contribute in 2023?
It turns out to be 327. Wow, that’s quite a bit of posts!
For non-returning users, who are ACTIVE on X, how many posts did they contribute in 2023?
It turns out to be 942. Wow! This can be a LOT of reasons such as unable to attend, too busy at the conference and did not post anything (fyi repost/retweet/quote would not count), used a different tag etc. That means these users are still on X and active! 🙌 At least that’s my hypothesis.
Simulation
The point of simulation is to create multiple trials to answer the question whether IDWeek community has left X which we use being active here as a proxy to that latent variable.
OK, so how does this work? Since these are counts, we will use Poisson distribution to generate random data. Since there were 2677 tweets for #IDweek2023, 1695 tweets for #IDweek2024, and 450 contributed tweets by non-returning and non-active users & non-existing users, we are going to use these numbers as the lambdas (means) for Poisson parameter. We will simulate 1000 trials.
set.seed(1)
n <- 1000
idw23 <- rpois(n, nrow(idweek23))
idw24 <- rpois(n, nrow(idweek24))
missing <- rpois(n, stat2$total_posts + nrow(stat4))
potential24 <- idw24 + missing

tibble(idweek23=idw23, actual_idweek24=idw24, potential_idweek24=potential24) |>
  pivot_longer(cols = everything(), names_to = "year", values_to = "total") |>
  mutate(year = fct_relevel(year, "idweek23", "actual_idweek24", "potential_idweek24")) |>
  ggplot(aes(x=year,y=total, fill=year,color=year)) +
  geom_jitter(alpha=0.2) +
  geom_boxplot(alpha=0.8) +
  theme_bw() +
  ggtitle("Simulated #IDweek2023, #IDweek2024, and Potential #IDweek2024") +
  theme(legend.position = "none")
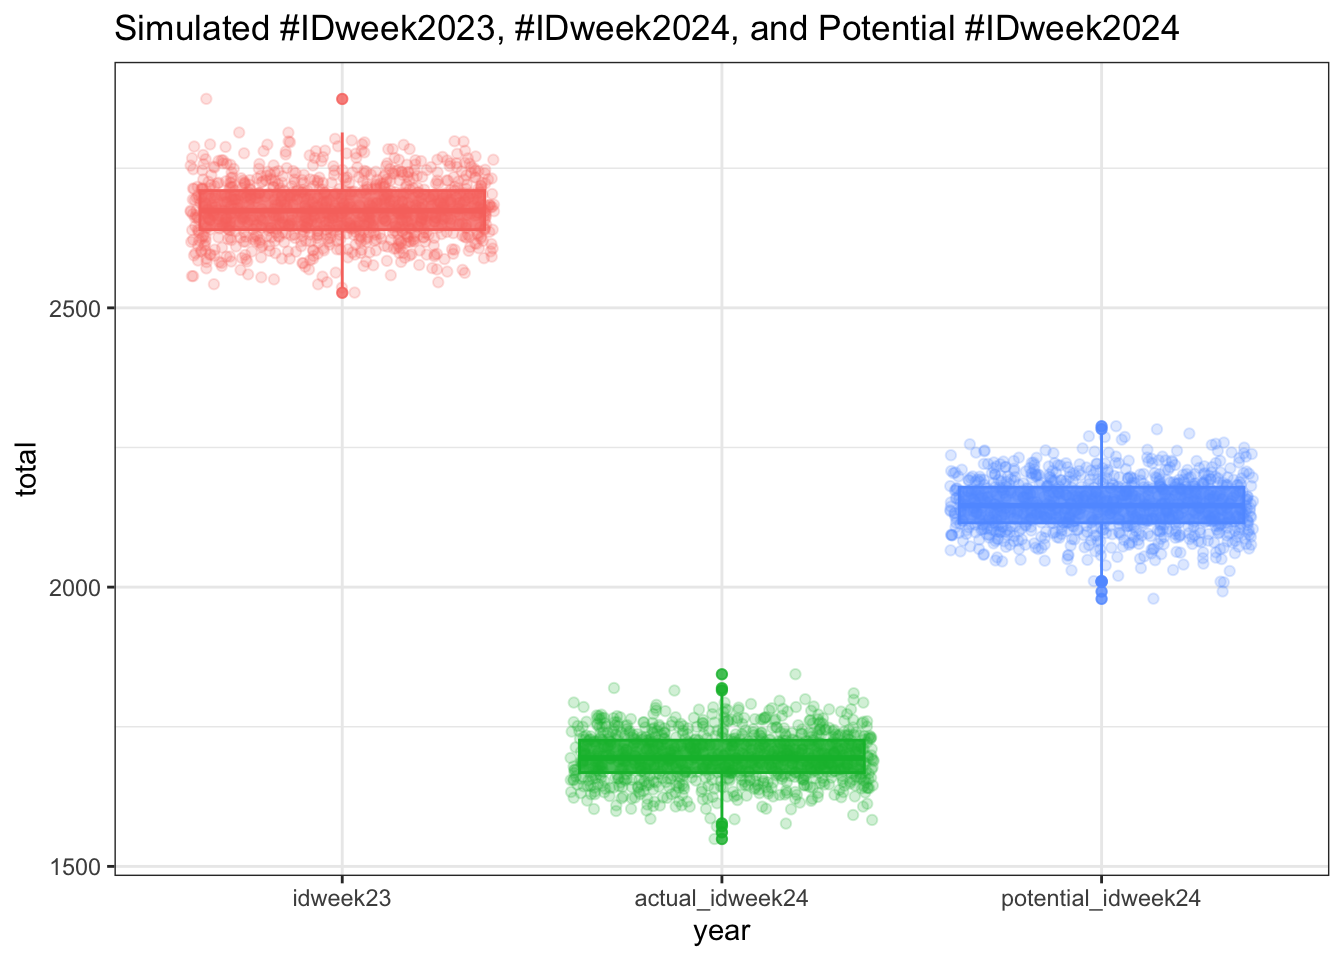
Looking at the visualization, the upper bound of potential_idweek24 which is simulated idweek2024 counts plus potentially missing tweets is no where near the lower bound of idweek23! Since eye-ing is a heuristic and can be erroneous. Let’s verify! Three sigma of lower bound #IDweek2023 is 2542 and 3 sigma of upper bound potential #IDweek2024 is 2259.035. There you have it!
I do wonder last year was just a much tweeted event due to its topics, venue, or some factors. But with all the information and this simulation, I’m more likely to believe IDweek community is still here on X / Twitter! ❤️🙌🙏
Limitations
- Assuming posts/tweets were generated by a human, we know this is not all entirely true, last year we had quite a few irrelevant tweets by either bots or spammers (but wouldn’t be enough to cause an effect)
- Poisson distribution requires underlying assumption of mean == variance, and does not handle overdispersion well. Tweet counts may not necessary follow this distribution. Other distribution such as negative binomial might be more accurate.
- There were definitely posts that were not captured if one did not use
#IDweek2023, #IDweek2024, or idweek. We will have some missing data issue, which I believe might be MCAR
Acknowledgements
I would like to thank Joseph Marcus & Tim Gauthier for the movitation of further investigation! This does not mean that there wasn’t / isn’t an exodus of #IDTwitter community since this does not look at that. We mainly looked at #IDweek tweets.
Lessons Learnt:
- Always check your data, and do some sanity check
- #IDWeek community hopefully is here to stay!
- Labelling / commenting your data & code is so important! I had a hard time trying to come back to the variables and making sense of it
If you like this article:
- please feel free to send me a comment or visit my other blogs
- please feel free to follow me on twitter, GitHub or Mastodon
- if you would like collaborate please feel free to contact me
- Posted on:
- October 25, 2024
- Length:
- 6 minute read, 1237 words